Data Analysis Project
Before starting this assignment, please download R and
RStudio Desktop on your computer. Both are open-source and
free to use.
Detailed installation instructions can be found here
To complete this assignment, students must download the
R notebook template and open the file in their RStudio
application. Please click the button below to download the template.
After completing the assignment, please upload the template
(.Rmd file) to Blackboard as your submission.
Introduction
This semester we will be working with a dataset of auto claims filed by customers of an automobile insurance company located in the southwest and western regions of the United States.
Insurance companies depend on accurate pricing estimates to maintain profitability. Auto policies must be priced so that the insurance company makes a profit in the long run, given the costs of their customers’ payouts for accident repairs, total loss car replacements, medical fees, and legal fees.
The executives at this insurance company have noticed declining profitability over the last several years and have hired you as a data science consultant to evaluate their claims data and make recommendations on pricing, customer behavior, and car insurance policy adjustments.
The objective of this project is to perform an exploratory data
analysis on the claims_df dataset and produce an executive
summary of your key insights and recommendations to the executive team
at the insurance company.
Before you begin, take a moment to read through the following insurance company terms to familiarize yourself with the industry: Auto Insurance Terms
Auto Claims Data
The claims_df data frame is loaded below and consists of
6,249 auto claims submitted by customers of the insurance company. The
rows in this data frame represent a single claim with all of the
associated features that are displayed in the table below.
library(tidyverse)

claims_df <- readRDS(url('https://gmubusinessanalytics.netlify.app/data/claims_df.rds'))
Variable Information
| Variable | Definition | Data Type |
|---|---|---|
| customer_id | Customer identifier | Character |
| customer_state | State of residence | Factor |
| highest_education | Highest level of education | Factor |
| employment_status | Employment status at time of claim | Factor |
| gender | Gender | Factor |
| income | Income (US Dollars) | Numeric |
| residence_type | Customer residence type | Factor |
| marital_status | Marital status | Factor |
| sales_channel | Customer acquisition method | Factor |
| coverage | Auto policy tier | Factor |
| policy | Auto policy type | Factor |
| vehicle_class | Vehicle type | Factor |
| vehicle_size | Vehicle size | Factor |
| monthly_premium | Customer monthly premium | Numeric |
| months_policy_active | Number of months policy has been active | Numeric |
| months_since_last_claim | Number of months since last claim | Numeric |
| current_claim_amount | Current claim amount | Numeric |
| total_claims | Total number of claims in customer history | Numeric |
| total_claims_amount | Total amount of all claims in customer history | Numeric |
| customer_lifetime_value | Customer lifetime value (total revenue - total claims cost) | Numeric |
Raw Data
claims_df
Exploratory Data Analysis
Executives at this company have hired you as a data science consultant to evaluate their claims data and make recommendations on pricing, customer behavior, and car insurance policy adjustments.
You must think of at least 8 relevant questions that will provide evidence for your recommendations.
The goal of your analysis should be discovering which variables drive the differences between customers with large lifetime values and customers who cost the company more than they provide in revenue through monthly premiums.
Some of the many questions you can explore include:
Are there types of customers, based on their policy or demographics, that are highly profitable?
Do certain policies have a lower number of claims, leading to large profits?
Are there “problem customers” which have a large number of claims?
You must answer each question and provide supporting data summaries
with either a summary data frame (using
dplyr/tidyr) or a plot (using
ggplot) or both.
In total, you must have a minimum of 5 plots and 4 summary data frames for the exploratory data analysis section. Among the plots you produce, you must have at least 4 different types (ex. box plot, bar chart, histogram, heat map, etc…)
Note: To add an R code chunk to any section of your
project, you can use the keyboard shortcut Ctrl +
Alt + i or the insert button at
the top of your R project template notebook file.
Each question must be answered with supporting evidence from your tables and plots.
See the example question below.
Sample Question
The sample below is from a previous semester where students analyzed a dataset with information on employees of a company and whether they decided to leave the company for another job.
The question, R code, and answer are examples of the
correct style and language that you should use for your work.
Question
Is there a relationship between employees leaving the company and their current salary?
Answer: Yes, the data indicates that employees who leave the company tend to have lower salaries when compared to employees who do not. Among the 237 employees that left the company, the average salary was $76,625. This is over $20,000 less than the average salary of employees who did not leave the company.
Among the employees who did not leave the company, only 10% have a salary that is less than or equal to $60,000. When looking at employees who did leave the company, this increases to 34%.
Summary Table
employee_data %>% group_by(left_company) %>%
                  summarise(n_employees = n(),
                            min_salary = min(salary),
                            avg_salary = mean(salary),
                            max_salary = max(salary),
                            sd_salary = sd(salary),
                            pct_less_60k = mean(salary <= 60000))
Data Visulatization
ggplot(data = employee_data, aes(x = salary, fill = left_company)) +
   geom_histogram(aes(y = ..density..), color = "white", bins = 20) +
   facet_wrap(~ left_company, nrow = 2) +
   labs(title = "Employee Salary Distribution by Status (Left the Comapny - Yes/No)",
           x = "Salary (US Dollars", y = "Proportion of Employees")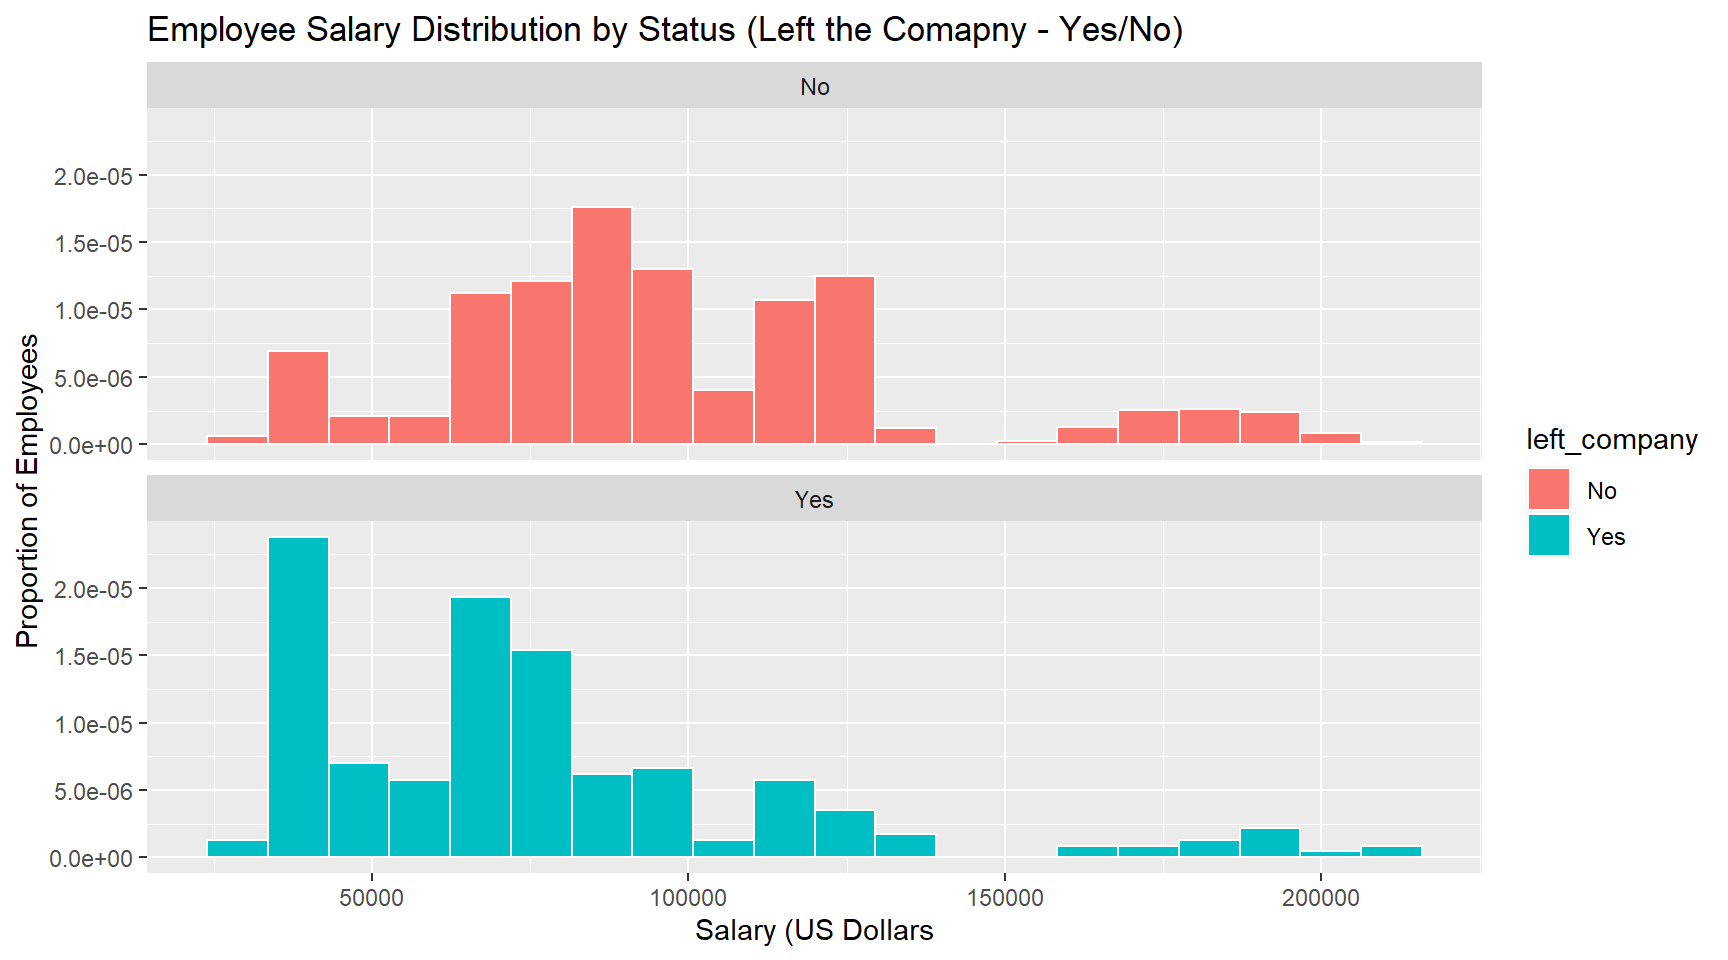
Summary of Results
Write an executive summary of your overall findings and recommendations to the executives at this company. Think of this section as your closing remarks of a presentation, where you summarize your key findings and make recommendations to improve pricing, company operations, and car insurance policy adjustments.
Your executive summary must be written in a professional tone, with minimal grammatical errors, and should include the following sections:
An introduction where you explain the business problem and goals of your data analysis
What problem(s) is this company trying to solve? Why are they important to their future success?
What was the goal of your analysis? What questions were you trying to answer and why do they matter?
Highlights and key findings from your Exploratory Data Analysis section
What were the interesting findings from your analysis and why are they important for the business?
This section is meant to establish the need for your recommendations in the following section
Your recommendations to the company
Each recommendation must be supported by your data analysis results
You must clearly explain why you are making each recommendation and which results from your data analysis support this recommendation
You must also describe the potential business impact of your recommendation:
Why is this a good recommendation?
What benefits will the business achieve?
Copyright © David Svancer 2023 |